


\(\begin{array}{c|c} class& 1 - 3 & 4 - 6 & 7 - 9\\ \hline Frequency & 5 & 8 & 5\end{array}\)
Find the standard deviation of the data using the table above
The mean of ten positive numbers is 16. When another number is added, the mean becomes 18. Find the eleventh number
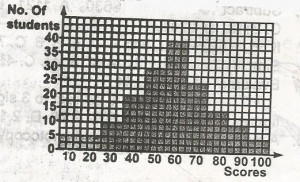
The histogram above represents the number of candidates that sat for Mathematics examination in a school. How many candidate scored more than 50 marks?
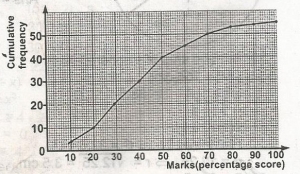
The cumulative frequency curve above shows the distribution of the scores of 50 students in an examination. Find the 36th percentile scores?
The mean of ten positive numbers is 16. When another number is added, the mean becomes 18. Find the eleventh number