


If the mean of the numbers 0, (x+2), (3x+6), and (4x+8) is 4, find their mean deviation.
Given that the various faces of a fair dice 1, 2, 3, 4, 5, 6 appeared 30, 43, 54, 40, 41, 32 times respectively in a single toss. Picture the figures as being represented in a simple table with number (X) against frequency (f).
If a pie chart is used to depict the data, the angle corresponding to 4 is?
The variance of x, 2x, 3x, 4x and 5x is

Find the sum of the range and the mode of the set of numbers 10, 9, 10, 9, 8, 7, 7, 10, 8, 10, 8, 4, 6, 9, 10, 9, 10, 9, 7, 10, 6, 5
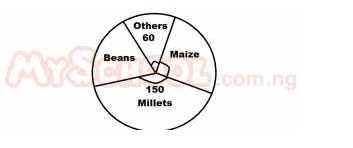
The pie chart above shows the distribution of the crops harvested from a farmland in a year. If 3000 tonnes of millet is harvested, what amount of beans is harvested
