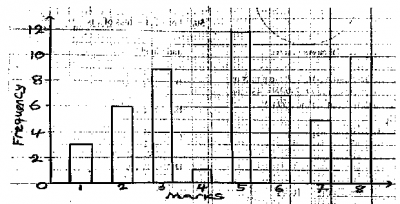
The bar chart represents the distribution of marks scored by students in an economics examination. Use the bar chart to answer questions 30 to 32
If the failed mark was 4, what is the probability that a student selected at random passed?

What percentage of the students scored at most 5 marks?
Find the mean deviation of assets of numbers: 14, 15, 16, 17, 18, and 19.