


Using a ruler and a pair of compasses only,
(a) construct (i) a triangle ABC such that |AB| = 5cm, |AC| = 7.5cm and < CAB = 120° ; (ii) the locus \(L_{1}\) of points equidistant from A and B ; (iii) the locus \(L_{2}\) of points equidistant from Ab and AC, which passes through the triangle ABC.
(b) Label the point P where \(L_{1}\) and \(L_{2}\) intersect;
(c) Measure |CP|.
The table below shows the frequency distribution of the marks of 800 candidates in an examination.
| Marks | 0-9 | 10-19 | 20-29 | 30-39 | 40-49 | 50-59 | 60-69 | 70-79 | 80-89 | 90-99 |
| Freq | 10 | 40 | 80 | 140 | 170 | 130 | 100 | 70 | 40 | 20 |
(a) (i) Construct a cumulative frequency table ; (ii) Draw the Ogive ; (iii) Use your ogive to determine the 50th percentile.
(b) The candidates that scored less than 25% are to be withdrawn from the institution, while those that scored than 75% are to be awarded scholarship. Estimate the number of students that will be retained, but will not enjoy the award.
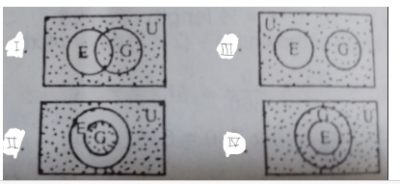
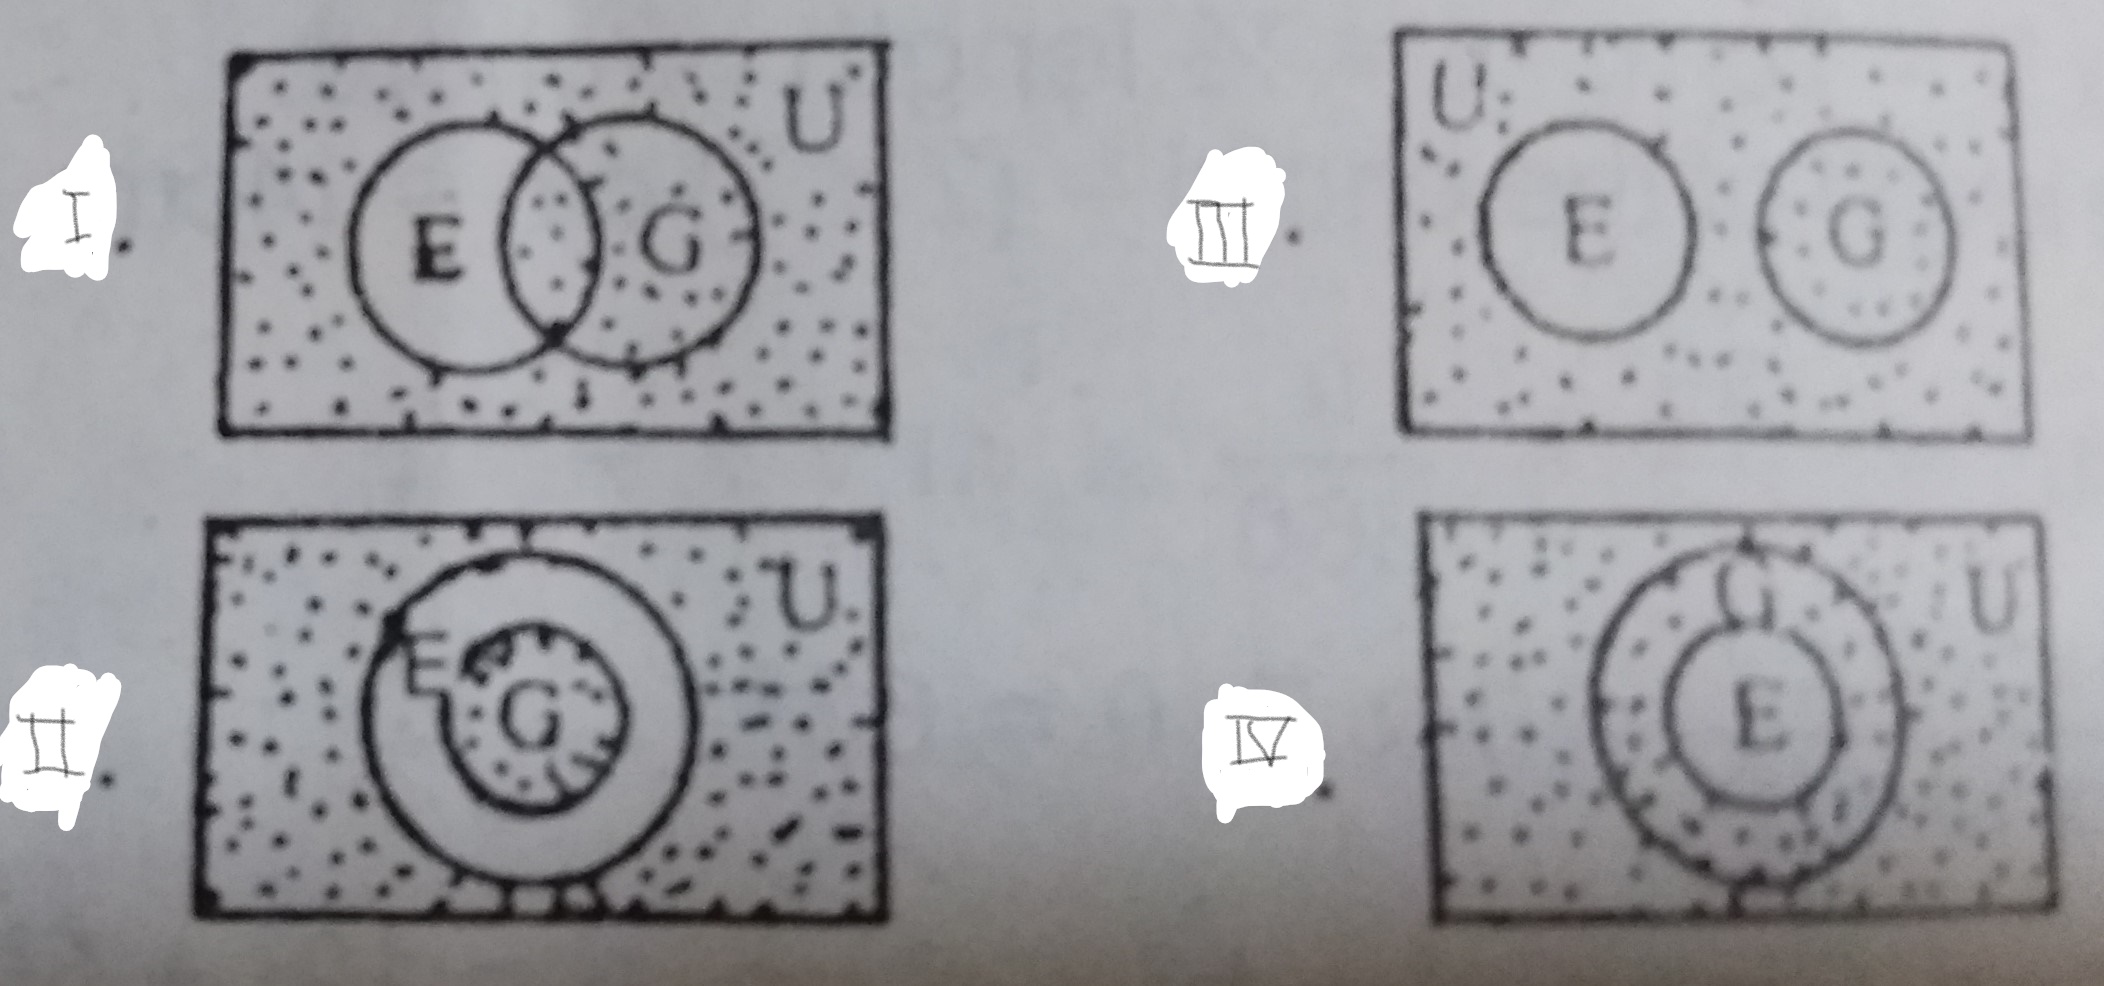
If \(E \subseteq G \subseteq U\), where U is the universal set, then the shaded venn diagram representing \(U - E\) or \(E^{c}\) is

Subtract 16418\(_9\) from 18630\(_9\).
Solve \(5^{2(x - 1)} \times 5^{x + 1} = 0.04\)
