


The sets A = {1, 3, 5, 7, 9, 11}, B = {2, 3, 5, 7, 11, 15} and C = {3, 6, 9, 12, 15} are subsets of \(\varepsilon\) = {1, 2, 3, ..., 15}.
(a) Draw a Venn diagram to illustrate the given information.
(b) Use your diagram to find : (i) \(C \cap A'\) ; (ii) \(A' \cap (B \cup C)\).
(a) A manufacturer offers distributors a discount of \(20%\) on any article bought and a further discount of \(2\frac{1}{2}%\) for prompt payment.
(i) if the marked price of an article is N25,000, find the total amount saved by a distributor for paying promptly. (ii) if a distributor pays N11,700 promptly for an article marked Nx, find the value of x.
(b) Factorize \(6y^{2} - 149y - 102\), hence solve the equation \(6y^{2} - 149y - 102 = 0\).
(a) Without using calculator or mathematical tables, evaluate \(\frac{3}{\sqrt{3}}(\frac{2}{\sqrt{3}} - \frac{\sqrt{12}}{6})\)
(b) 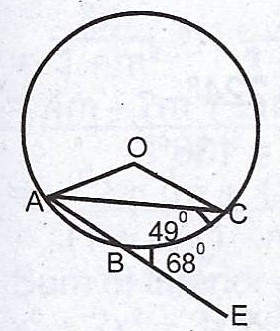 In the diagram, O is the centre of the circle. The side AB is produced to E, < ACB = 49° and < CBE = 68°. Calculate,
(i) the interior angle AOC ; (ii) < BOC.


The probabilities that Ade, Kujo and Fati will pass an examination are \(\frac{2}{3}, \frac{5}{8}\) and \(\frac{3}{4}\) respectively. Find the probability that
(a) the three ;
(b) none of them ;
(c) Ade and Kujo only ; will pass the examination.
(a) Simplify : \(\frac{1}{2}\log_{10} 25 - 2\log_{10} 3 + \log_{10} 18\)
(b) If \(123_{y} = 83_{10}\), obtain an equation in y, hence find the value of y.
(c) Solve the equation \(\frac{9^{2x - 3}}{3^{x + 3}} = 1\)