


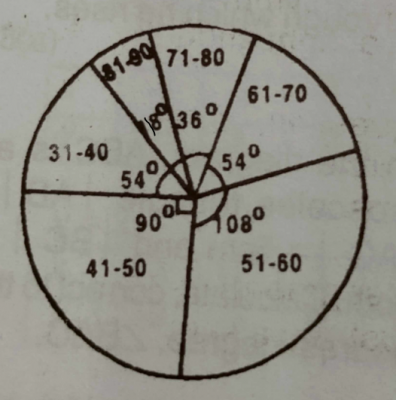
The pie chart above shows the distribution of marks scored by 200 pupils in a test.
(a) How many pupils scored : (i) between 41 and 50 marks? ; (ii) above 80 marks?
(b) What fraction of the pupils scored at most 50 marks?
(c) What is the modal class?
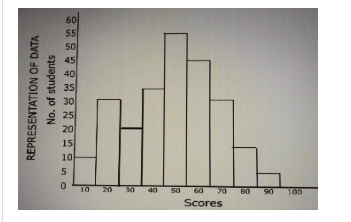
The histogram above represents the number of candidates who did Further Mathematics examination in a school. How many candidates scored more than 40?
The mean of ten positive numbers is 16. When another number is added, the mean becomes 18. Find the eleventh number

find the first quartile of 7,8,7,9,11,8,7,9,6 and 8.
| Height(cm) | 160 | 161 | 162 | 163 | 164 |
165 |
| No. of players | 4 | 6 | 3 | 7 | 8 | 9 |
the table shows the height of 37 players of a basketball team calculates correct to one decimal place the mean height of the players.
