


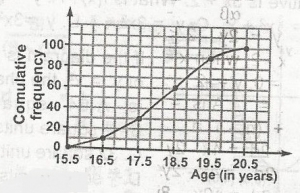
The cumulative frequency curve represents the ages of ages of students in a school. What age group do 70% of the students belongs?
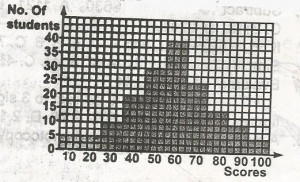
The histogram above represents the number of candidates that sat for Mathematics examination in a school. How many candidate scored more than 50 marks?
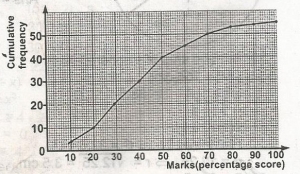
The cumulative frequency curve above shows the distribution of the scores of 50 students in an examination. Find the 36th percentile scores?


Using the histogram, what is the median class?
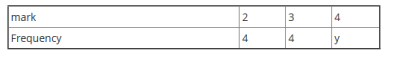
| mark | 2 | 3 | 4 |
| Frequency | 4 | 4 | y |
The table above shows the frequency distribution of marks obtained by a group of students. If the total mark is 48, find the value of y.