


The ages of students in a small primary school were recorded in the table below.
| Age | 5 - 6 | 7 - 8 | 9 -10 |
| Frequency | 29 | 40 | 38 |
Estimate the mean
The ages of students in a small primary school were recorded in the table below.
| Age | 5-6 | 7-8 | 9-10 |
| Frequency | 29 | 40 | 38 |
Estimate the median.
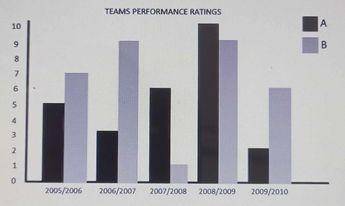
The graph above depicts the performance ratings of two sports teams A and B in five different seasons
In the last five seasons, what was the difference in the average performance ratings between Team B and Team A?

Which of the following is a measure of central tendency?
Calculate the standard deviation of the following scores 5, 4, 6, 7, and 8
