


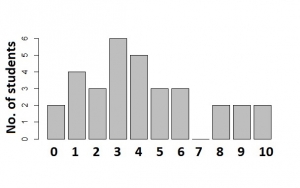
The bar chart shows the distribution of marks scored by a group of students in a test. Use the chart to answer the question below
How many students took the test?
How many students are there in the group?
Find the standard deviation of 2, 3, 5 and 6

\(\begin{array}{c|c} class& 1 - 3 & 4 - 6 & 7 - 9\\ \hline Frequency & 5 & 8 & 5\end{array}\)
Find the standard deviation of the data using the table above
The mean of ten positive numbers is 16. When another number is added, the mean becomes 18. Find the eleventh number
