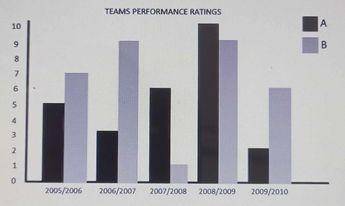
The graph above depicts the performance ratings of two sports teams A and B in five different seasons
In the last five seasons, what was the difference in the average performance ratings between Team B and Team A?

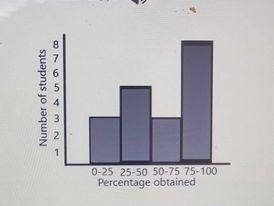
Study the given histogram above and answer the question that follows.
What is the total number of students that scored at most 50 marks?