


\(\begin{array}{c|c} \text{Age in years} & 13 & 14 & 15 & 16 & 17 \\ \hline \text{No. of students} & 3 & 10 & 30 & 42 & 15\end{array}\)
The frequency distribution above shows the ages of students in a secondary school. In a pie chart constructed to represent the data, the angles corresponding to the 15 years old is
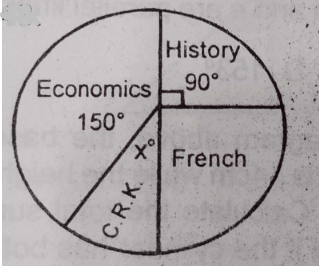
The pie chart shows the distribution of students in a secondary school class. If 30 students offered French, how many offered C.R.K?
\(\begin{array}{c|c} class& 1 - 3 & 4 - 6 & 7 - 9\\ \hline Frequency & 5 & 8 & 5\end{array}\)
Find the standard deviation of the data using the table above

The variance of the scores 1, 2, 3, 4, 5 is
\(\begin{array}{c|c} \text{Class Interval} & Frequency & \text{Class boundaries} & Class Mid-point \\ \hline 1.5 - 1.9 & 2 & 1.45 - 1.95 & 1.7\\ 2.0 - 2.4 & 1 & 1.95 - 2.45 & 2.2\\ 2.5 - 2.9 & 4 & 2.45 - 2.95 & 2.7 \\ 3.0 - 2.9 & 15 & 2.95 - 3.45 & 3.2\\ 3.5 - 3.9 & 10 & 3.45 - 3.95 & 3.7\\ 4.0 - 4.4 & 5 & 3.95 - 4.45 & 4.2\\ 4.5 - 4.9 & 3 & 4.45 - 4.95 & 4.7\end{array}\)
Find the mode of the distribution.
