


| Marks | 1 | 2 | 3 | 4 | 5 |
| Frequency | 2 | 2 | 8 | 4 | 4 |
The table above show the marks obtained in a given test.
How many student took the test?
| Marks | 1 | 2 | 3 | 4 | 5 |
| Frequency | 2 | 2 | 8 | 4 | 4 |
The table above show the marks obtained in a given test.
Find the mean mark
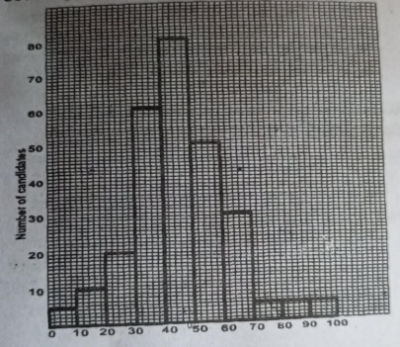
The histogram below shows the number of candidates, in thousands, obtaining given ranges of marks in a State examination. Find the total number of candidates that sat for the examination


| Score | 1 | 2 | 3 | 4 | 5 | 6 | 7 | 8 | 9 |
| Frequency | 2 | 3 | 6 | 7 | 9 | 6 | 2 | 2 | 3 |
The table above shows the scores of a group of 40 students in a physics test
What is the mean of the distribution?
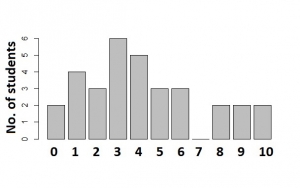
The bar chart shows the distribution of marks scored by a group of students in a test. Use the chart to answer the question below
How many students scored 4 marks and above?