


The population of students in a school is 810. If this is represented on a pie chart, calculate the sectoral angle for a class of 72 students
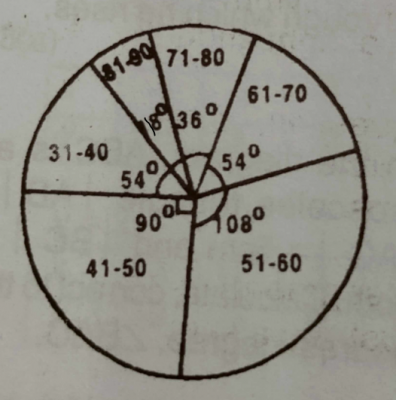
The pie chart above shows the distribution of marks scored by 200 pupils in a test.
(a) How many pupils scored : (i) between 41 and 50 marks? ; (ii) above 80 marks?
(b) What fraction of the pupils scored at most 50 marks?
(c) What is the modal class?
4, 16, 30, 20, 10, 14 and 26 are represented on a pie chart. Find the sum of the angles of the bisectors representing all numbers equals to or greater than 16

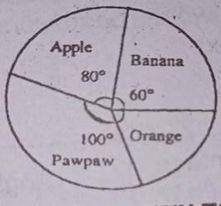
The pie chart represents the distribution of fruits on display in the shop if there are 60 apples on display how many oranges are there?
The ages of students in a small primary school were recorded in the table below.
| Age | 5 - 6 | 7 - 8 | 9 -10 |
| Frequency | 29 | 40 | 38 |
Estimate the mean
