Your School's Whatsapp Group - Join Us now
Post UTME Past Questions Agent

Mathematics Past Questions

Clear Selections
Change Subject Post a Question Check Syllabus Study My Bookmarks Past Questions Videos Watch Video Lessons Download App

Your School's Whatsapp Group - Join Us now
WAEC and NECO CBT App for Mobile Devices - Candidates, Schools, Centres, Resellers - 100% Offline -Download Now
Post UTME Past Questions Agent
1

Given that the various faces of a fair dice 1, 2, 3, 4, 5, 6 appeared 30, 43, 54, 40, 41, 32 times respectively in a single toss. Picture the figures as being represented in a simple table with number (X) against frequency (f).

If a pie chart is used to depict the data, the angle corresponding to 4 is?

  • A. 10°
  • B. 16°
  • C. 40°
  • D. 60°
View Answer & Discuss (12) JAMB 2000
2

On a pie chart there are six sectors of which four angles are 30°, 45°, 60°, 90° and the remaining two angles are in the ratio 2:1. Find the smallest angles of the remaining two angles.

  • A. 15o
  • B. 30o
  • C. 45o
  • D. 60o
View Answer & Discuss JAMB 2008
3

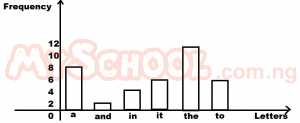
The bar chart above shows the number of times the word "a, and , in, it, the ,to" appear in a paragraph in a book.

What is the ratio of the least frequent word to the most frequent word?

  • A. 1/6
  • B. 1/3
  • C. 2/3
  • D. 3/4
View Answer & Discuss (3) JAMB 2008
WAEC and NECO CBT App for Mobile Devices - Candidates, Schools, Centres, Resellers - 100% Offline -Download Now
WAEC and NECO CBT Software for Computers and Laptops - Candidates, Schools, Centres, Resellers - 100% Offline -Download Now
Post-UTME Past Questions - Original materials are available here - Download PDF for your school of choice + 1 year SMS alerts
4

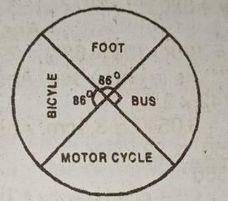
The pie chart above show the distribution of how students travelled to a certain school on a particular day. Use this information to answer the question below
If a hundred students travelled by bus, find the total number of students in the school

  • A. 300
  • B. 400
  • C. 500
  • D. 600
  • E. 750
View Answer & Discuss (8) WAEC 1998
5

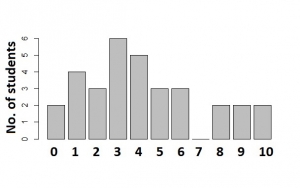
The bar chart shows the distribution of marks scored by a group of students in a test. Use the chart to answer the question below
How many students scored 4 marks and above?

  • A. 15
  • B. 11
  • C. 10
  • D. 17
View Answer & Discuss (15) WAEC 2000
Start a Free Practice Test
 
Post-UTME Past Questions - Original materials are available here - Download PDF for your school of choice + 1 year SMS alerts
Post UTME Past Questions Agent
Your School's Whatsapp Group - Join Us now
WAEC and NECO CBT Software for Computers and Laptops - Candidates, Schools, Centres, Resellers - 100% Offline -Download Now