


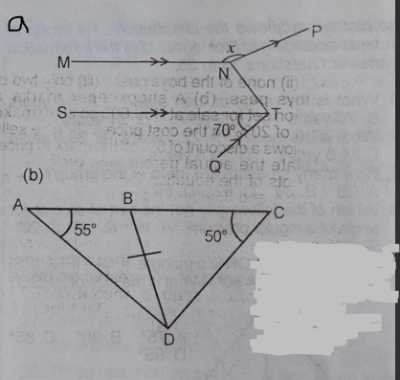
(a) see figure a above, In the diagram, MN || ST, NP || QT and < STQ = 70°. Find x.
(b) see figure b above, In the diagram above, AC is a straight line, |BC| = |BD|, \(\stackrel\frown{BCD} = 50°\) and \(\stackrel\frown{BAD} = 55°\). Find \(\stackrel\frown{BDA}\).
(a) Draw the table of values for the relation \(y = x^{2}\) for the interval \(-3 \leq x \leq 4\).
(b) Using a scale of 2 cm to 1 unit on the x- axis and 2 cm to 2 units on the y- axis, draw the graphs of : (i) \(y = x^{2}\) ; (ii) \(y = 2x + 3\) for \(-3 \leq x \leq 4\).
(c) Use your graph to find : (i) the roots of the equation \(x^{2} = 2x + 3\) ; (ii) the gradient of \(y = x^{2}\) at x = -2.
The number of child births recorded in 50 maternity centres of a local government in August 1993 are as follows :
50 99 81 86 69 85 93 63 92 65 77 74 76 71 90 74 81 94 67 75 95 81 68 105 99 68 75 75 76 73 79 74 80 69 74 62 74 80 79 68 79 75 75 71 83 75 80 85 81 82
(a) Construct a frequency distribution table, using class intervals 45 - 54, 55 - 64, etc.
(b) Draw the histogram for the distribution
(c) Use your histogram to estimate the mode.
(d) Calculate the mean number of births.

(a) In a market survey, 100 traders sell fruits, 40 sell apples, 46 oranges, 50 mangoes, 14 apples and oranges, 15 apples and mangoes and 10 sell the three types of fruits. Each of the 100 traders sells at least one of the three fruits.
(i) Represent the information in a Venn diagram ; (ii) Find the number that sell oranges and mangoes only.
(b) Find the value of x for which \(312_{four} + 52_{x} = 96_{ten}\)
(a) The probabilities that three boys pass an examination are \(\frac{2}{3}, \frac{5}{8}\) and \(\frac{3}{4}\) respectively. Find the probability that :
(i) all three boys pass ; (ii) none of the boys pass ; (iii) only two of the boys pass.
(b) A shop-keeper marks a television set for sale at N36,000 so as to make a profit of 20% on the cost price. When he sells it, he allows a discount of 5% of the marked price. Calculate the actual percentage profit.
