


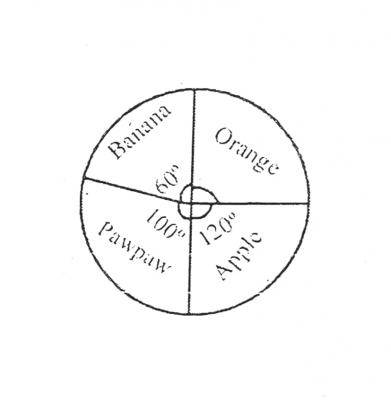
The pie chart represents fruits on display in a grocery shop. If there are 60 oranges on display, how many apples are there?
The following are scores obtained by some students in a test, Find the mode of the distribution
| 8 | 18 | 10 | 14 | 18 | 11 | 13 |
| 14 | 13 | 17 | 15 | 8 | 16 | 13 |
The following are scores obtained by some students in a test. Find the median score
| 8 | 18 | 10 | 14 | 18 | 11 | 13 |
| 14 | 13 | 17 | 15 | 8 | 16 | 13 |

8, 18, 10,14, 18, 11, 13, 14, 13, 17, 15, 8, 16, and 13
The following are scores obtained by some students in a test. How many students scored above the mean score?
Evaluate: \(\frac{0.42 \div 2.5}{0.5 \times 2.95}\), leaving the answer in the standard form.