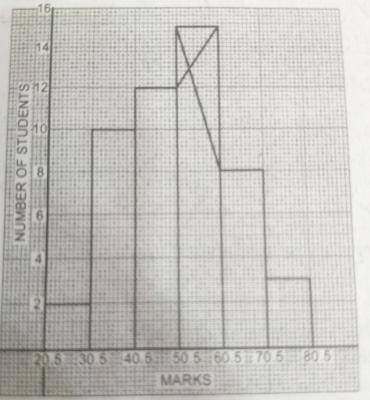
Using the histogram, estimate the mode of distribution
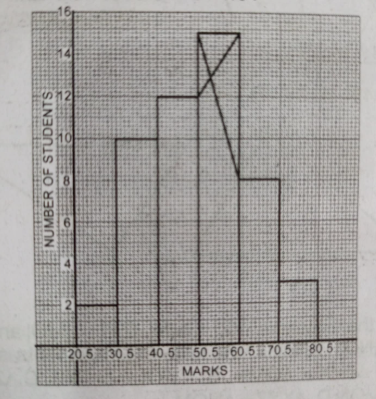
Using the histogram, what is the median class?
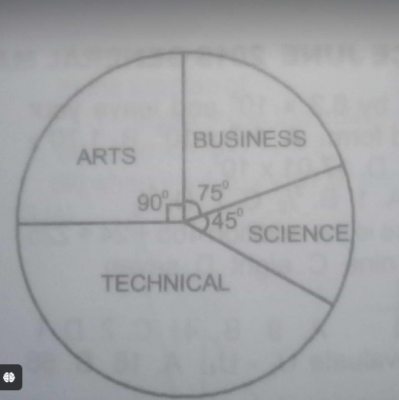
The pie chart shows the distribution of 600 mathematics textbooks for Arts, Business, Science and Technical Classes. How many textbooks are for the technical class?

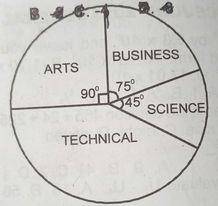
The pie chart shows the distribution of 600 mathematics textbooks for Arts, Business, Science and Technical Classes. What percentage of the total number of textbooks belongs to science?