


The frequency distribution shows tha marks of 100 students in a Mathematics test.
| Marks | 1-10 | 11-20 | 21-30 | 31-40 | 41-50 | 51-60 | 61-70 | 71-80 | 81-90 | 91-100 |
|
No. of Students |
2 | 4 | 9 | 13 | 18 | 32 | 13 | 5 | 3 | 1 |
(a) Draw cumulative frequency curve for the distribution .
(b) Use your curve to estimate : (i) the median ; (ii) the lower quartile ; (iii) the 60th percentile.
(a) Simplify : \(\sqrt{1001_{two}}\), leaving your answer in base two.
(b) 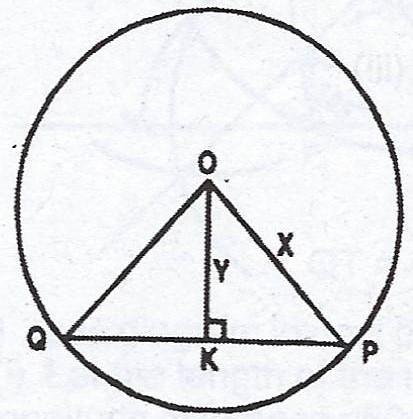
In the diagram, O is the centre of the circle radius x. /PQ/ = z, /OK/ = y and < OKP = 90°. Find the value of z in terms of x and y.
(c) 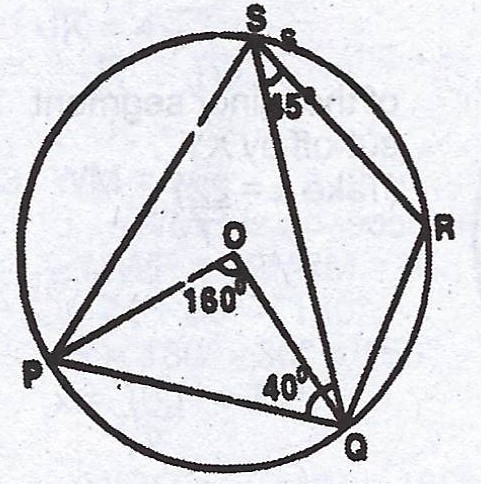
In the diagram, P, Q, R and S are points of the circle centre O. \(\stackrel\frown{POQ} = 160°\), \(\stackrel\frown{QSR} = 45°\) and \(\stackrel\frown{PQS} = 40°\). Calculate, (i) < QPS ; (ii) < RQS.
(a) Copy and complete the following table of values for the relation \(y = 2x^{2} - 7x - 3\).
| x | -2 | -1 | 0 | 1 | 2 | 3 | 4 | 5 |
| y | 19 | -3 | -9 |
(b) Using 2 cm to 1 unit on the x- axis and 2 cm to 5 units on the y- axis, draw the graph of \(y = 2x^{2} - 7x - 3\) for \(-2 \leq x \leq 5\).
(c) From your graph, find the : (i) minimum value of y ;
(ii) gradient of the curve at x = 1.
(d) By drawing a suitable straight line, find the values of x for which \(2x^{2} - 7x - 5 = x + 4\).
