


The sides of a rectangular floor are xm and (x + 7)m. The diagonal is (x + 8)m. Calculate, in metres :
(a) the value of x ;
(b) the area of the floor.
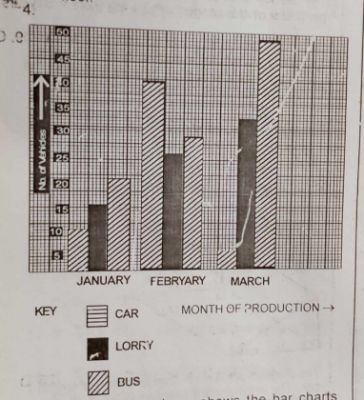
The diagram above shows the bar charts representing the number of vehicles manufactured by a company in January, February and March, 1992.
(a) How many vehicles were produced in February?
(b) What fraction of the vehicles manufactured in February were cars?
(c) How many buses were produced altogether from January to March, 1992?
(d) What is the ratio in the lowest term of the number of lorries produced in February to that in March?
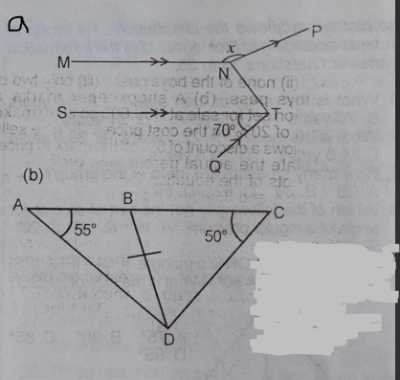
(a) see figure a above, In the diagram, MN || ST, NP || QT and < STQ = 70°. Find x.
(b) see figure b above, In the diagram above, AC is a straight line, |BC| = |BD|, \(\stackrel\frown{BCD} = 50°\) and \(\stackrel\frown{BAD} = 55°\). Find \(\stackrel\frown{BDA}\).

(a) Draw the table of values for the relation \(y = x^{2}\) for the interval \(-3 \leq x \leq 4\).
(b) Using a scale of 2 cm to 1 unit on the x- axis and 2 cm to 2 units on the y- axis, draw the graphs of : (i) \(y = x^{2}\) ; (ii) \(y = 2x + 3\) for \(-3 \leq x \leq 4\).
(c) Use your graph to find : (i) the roots of the equation \(x^{2} = 2x + 3\) ; (ii) the gradient of \(y = x^{2}\) at x = -2.
The number of child births recorded in 50 maternity centres of a local government in August 1993 are as follows :
50 99 81 86 69 85 93 63 92 65 77 74 76 71 90 74 81 94 67 75 95 81 68 105 99 68 75 75 76 73 79 74 80 69 74 62 74 80 79 68 79 75 75 71 83 75 80 85 81 82
(a) Construct a frequency distribution table, using class intervals 45 - 54, 55 - 64, etc.
(b) Draw the histogram for the distribution
(c) Use your histogram to estimate the mode.
(d) Calculate the mean number of births.

