


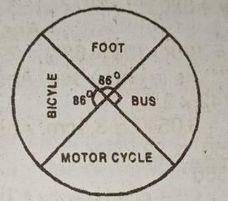
The pie chart above show the distribution of how students travelled to a certain school on a particular day. Use this information to answer the question below
If a hundred students travelled by bus, find the total number of students in the school
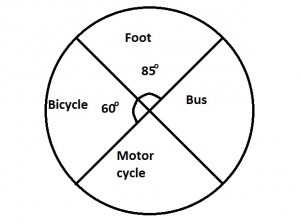
The pie chart above shows the distribution of how students travelled to a certain school on a particular day. Use this information to answer the question below
What percentage, to the nearest whole number, of the students travelled to school on foot?


In \(\triangle PQR\). T is a point on QR such that \(\angle QPT = 39^o and \angle PTR = 83^o. Calculate \angle PQT\)
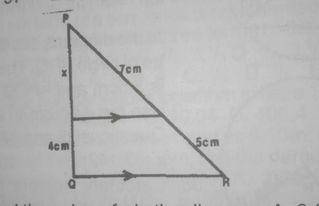
Find the value of x in the diagram above

