The value x in the figure given is

The bar chart above shows the allotment of time(in minutes) per week for selected subjects in a certain school. What is the total time allocated to the six subjects per week?
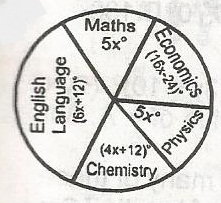
The pie chart above shows the statistical distribution of 80 students in five subjects in an examination. Calculate how many student offer Mathematics.