


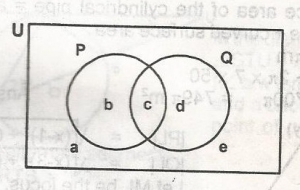
From the venn diagram above, the complement of the set P\(\cap\)Q is given by
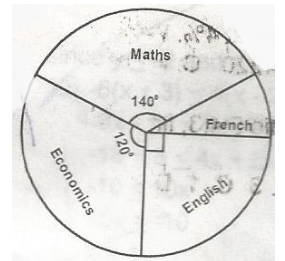
The pie chart shows the distribution of courses offered by students. What percentage of the students offer English?
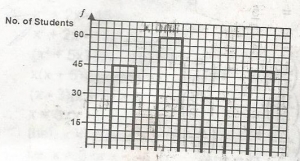
The bar chart above shows the distribution of SS2 students in a school.
Find the total number of students


The graph above is correctly represented by

