


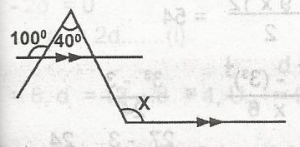
in the diagram above, calculate the value of x.
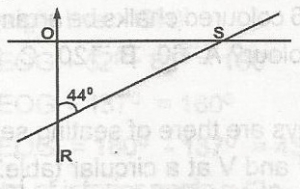
From the diagram given, find the bearing of R from S
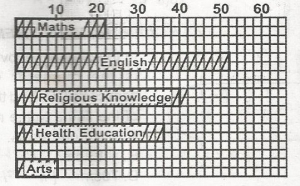
The response of 160 pupils in a school asked to indicate their favourite subjects is given in the bar chart above. What percentage of the pupils have English and Health education as the their favourite subjects?
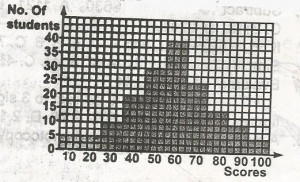
The histogram above represents the number of candidates that sat for Mathematics examination in a school. How many candidate scored more than 50 marks?
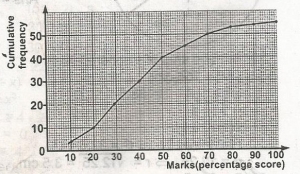
The cumulative frequency curve above shows the distribution of the scores of 50 students in an examination. Find the 36th percentile scores?

