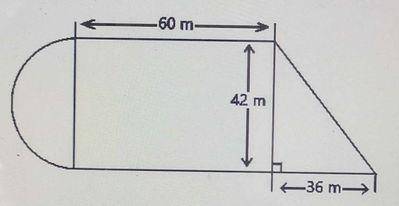
Calculate the area of the composite figure above.
Find the value of x in the diagram above
Which inequality describes the graph above?
Find the volume of a cone which has a base radius of 5 cm and slant height of 13 cm.
Study the given histogram above and answer the question that follows.
What is the total number of students that scored at most 50 marks?