


In diagram above, QR//TU, < PQR = 80° and < PSU = 95°. Calculate < SUT.
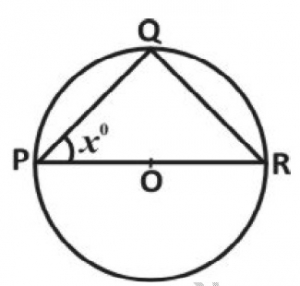
In the diagram above, PQR is a circle centre O. If < QPR is x°, find < QRP.
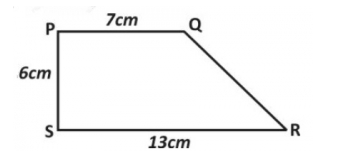
Find the area of the trapezium above.


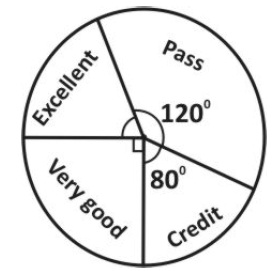
The grades of 36 students in a class test are as shown in the pie chart above. How many students have excellent?
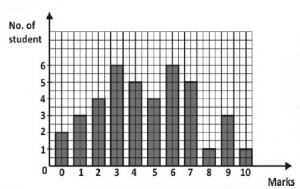
The bar chart above shows the distribution of marks in a class test. If the pass mark is 5, what percentage of students failed the test?