


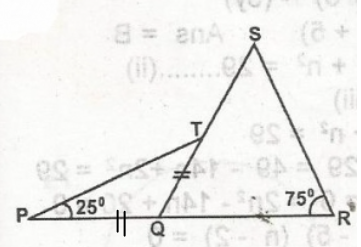
In the figure PQR a straight line segment, PQ = QT. Triangle PQT is an isosceles triangle, < SRQ is 75º and < QPT IS 25º. Calculate the value of < RST


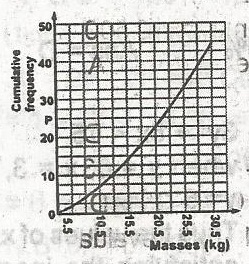
The graph shows the cumulative frequency of the distribution of masses of fertilizer for 48 workers in one institution. Which of the following gives the inter-quartile range?
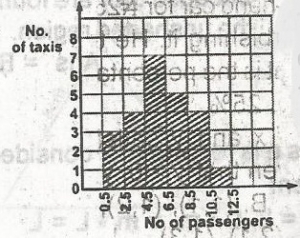
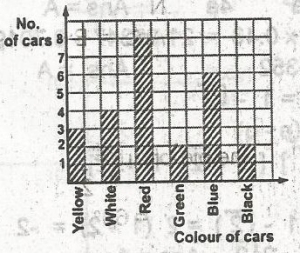
The histogram shows the distribution of passengers in taxis at a certain motor park. How many taxis have more than 4 passengers?
