


A man drove for 4 hours at a certain speed, he then doubled his speed and drove for another 3 hours. Although he covered 600 kilometers. At what speed did he drive for the last 3 hours?
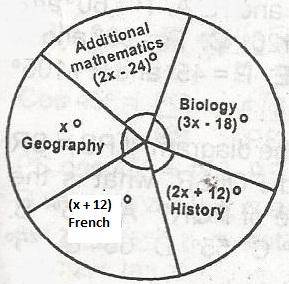
In a class of 60 pupils, the statistical distribution of the numbers of pupils offering Biology, History, French, Geography and Additional mathematics is as shown in the pie chart. How many pupils offer Additional Mathematics?

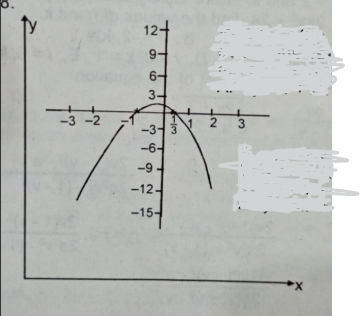
Which of the following equations represents the graph?
