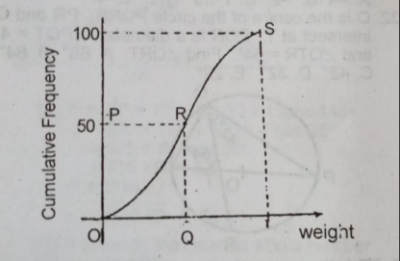
The graph is the cumulative frequency curve for the weight distribution of 100 workers in a factory. Which of the points P,Q,R,S and T indicates the median weight?
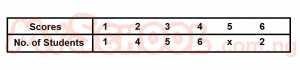
A bag contains red, black and green identical balls. A ball is picked and replaced. The table shows the result of 100 trials. Find the experimental probability of picking a green ball.