


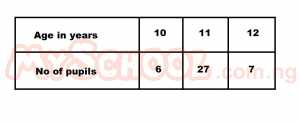
The table above shows the number of pupils in each age group in a class. What is the probability that a pupil chosen at random is at least 11 years old?
| Marks | 3 | 4 | 5 | 6 | 7 | 8 |
| Frequency | 5 | y - 1 | y | 9 | 4 | 1 |
The table above gives the frequency distribution of marks obtained by a group of students in a test. If the total mark scored is 200, calculate the value of y

