


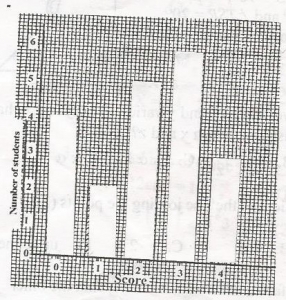
The bar chart shows the scores of some students in a test. If one students is selected at random, find the probability that he/she scored at most 2 marks

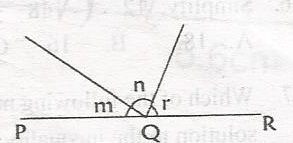
In the diagram, PQR is straight line, ( m + n) = 120o and ( n + r) = 100o. Find (m + r).

