


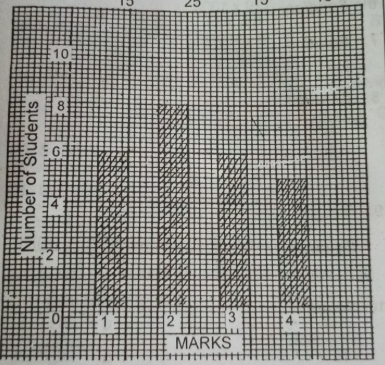
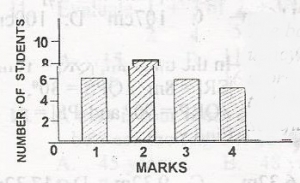
The bar chart shows the frequency distribution of marks scored by students in a class test. How many students are in the class?

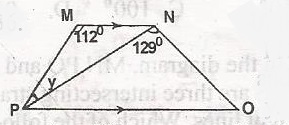
In the diagram, MN//PO, < PMN = 112º, < PNO = 129º, < NOP = 37º and < MPN = yo. Find the value of y

