Your School's Whatsapp Group - Join Us now
Post UTME Past Questions Agent

Mathematics Past Questions

Clear Selections
Change Subject Post a Question Check Syllabus Study My Bookmarks Past Questions Videos Watch Video Lessons Download App

Post-UTME Past Questions - Original materials are available here - Download PDF for your school of choice + 1 year SMS alerts
WAEC and NECO CBT App for Mobile Devices - Candidates, Schools, Centres, Resellers - 100% Offline -Download Now
WAEC and NECO CBT Software for Computers and Laptops - Candidates, Schools, Centres, Resellers - 100% Offline -Download Now
2546

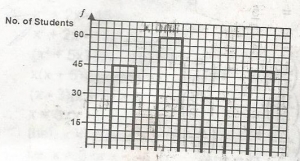
The bar chart above shows the distribution of SS2 students in a school.

Find the total number of students

  • A. 180
  • B. 135
  • C. 210
  • D. 105
View Answer & Discuss (5) JAMB 2011
2547

The graph above is correctly represented by

  • A. y = x2 - x - 2
  • B. y = x2 - 3x + 2
  • C. y = x2 - x - 1
  • D. y = x2 + x - 2
View Answer & Discuss JAMB 2013
2548
In the diagram given, find the value of x.
  • A. 30o
  • B. 40o
  • C. 45o
  • D. 15o
View Answer & Discuss JAMB 2013
Your School's Whatsapp Group - Join Us now
Post UTME Past Questions Agent
WAEC and NECO CBT Software for Computers and Laptops - Candidates, Schools, Centres, Resellers - 100% Offline -Download Now
2549

The value x in the figure given is

  • A. 110o
  • B. 100o
  • C. 70o
  • D. 130o
View Answer & Discuss (5) JAMB 2013
2550

The bar chart above shows the allotment of time(in minutes) per week for selected subjects in a certain school. What is the total time allocated to the six subjects per week?

  • A. 460mins
  • B. 720mins
  • C. 960mins
  • D. 200mins
View Answer & Discuss (4) JAMB 2013
Start a Free Practice Test
 
Post UTME Past Questions Agent
WAEC and NECO CBT Software for Computers and Laptops - Candidates, Schools, Centres, Resellers - 100% Offline -Download Now
Your School's Whatsapp Group - Join Us now
WAEC and NECO CBT App for Mobile Devices - Candidates, Schools, Centres, Resellers - 100% Offline -Download Now