


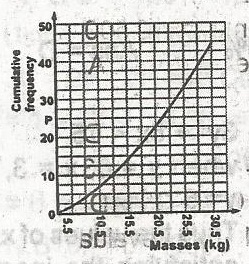
The graph shows the cumulative frequency of the distribution of masses of fertilizer for 48 workers in one institution. Which of the following gives the inter-quartile range?
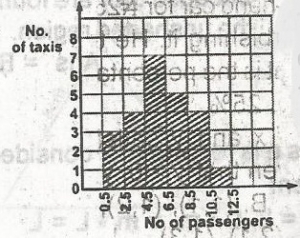
The histogram shows the distribution of passengers in taxis at a certain motor park. How many taxis have more than 4 passengers?

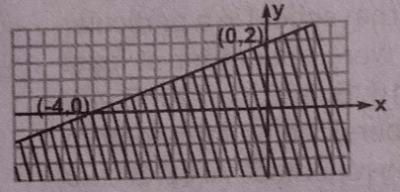
Use the graph above to find the values of p and q if px + qy \(\geq\) 4
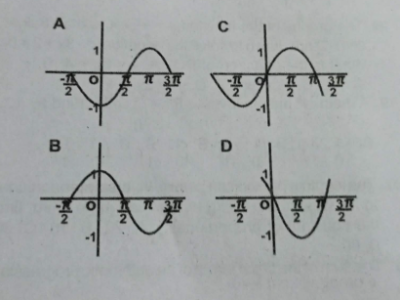
Which of the following is the graph of Sin\(\theta\) for -\(\frac{\pi}{2}\) \(\leq\) 0 \(\leq\) \(\frac{3\pi}{2}\)?
