Register
Login
Username
Password
Remember me
Sign in
New here ?
Join Us
Register
Login
Home
Buy Now
Enter Store
Books
Computer Software
Forms
JAMB
Mobile Apps
NECO
Video Lessons Subscription
WAEC
Whatsapp Groups
Post UTME Past Question
Project & Research Materials
Latest News
JAMB News
Post-UTME News
Admission News
O'Level News
Scholarships
Pre-Degree News
Post-Graduate News
Events
Entertainment News
Politics News
Part Time News
Departmental News
General News
Study Abroad News
IJMB News
Gist & Gossips
Noticeboard
NYSC
Nursing School News
Find a Scholarship
Classroom
Enter now to Study
Start a Free Practice Exam
Topic by Topic Video Lessons
Past Questions Video Lessons
Current JAMB Novel
All Novels
Latest JAMB Syllabus
Latest JAMB Brochure
Exam Ranking
Ask a Question
All Questions
School-Based Questions
Academic Questions
Connect2Me
Find Friend
Update your Profile
Sell an Item
Buy an Item
Sell an Item
Events
All Events
Post an Event
Groups
Join a Group
Create a Group
[ Post UTME Begins ]:
View The List Of Schools That Have Released 2026 Post-UTME Forms.
Home
Classroom
Geography
JAMB 1985
Geography 1985 JAMB Past Questions
Exam Type:
All
JAMB
WAEC
NECO
Exam year:
All
2025
2024
2023
2022
2021
2020
2019
2018
2017
2015
2014
2013
2012
2011
2010
2009
2008
2007
2006
2005
2004
2003
2002
2001
2000
1999
1998
1997
1995
1994
1993
1992
1991
1990
1989
1988
1987
1986
1985
1984
1983
1982
1981
1980
1979
1978
Question Type:
All
Objective
Theory
Practical
Get Questions
Clear Selections
Change Subject
Post a Question
Check Syllabus
Study My Bookmarks
Past Questions Videos
Watch Video Lessons
Download App
41
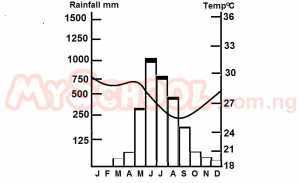
Study the table below, which shows the mean climatic conditions at station Y, and answer question below
J
F
M
J
J
J
A
S
S
O
N
D
*
T (
o
C)
22.1
24.1
27.5
30.9
31.5
30.0
27.3
25.8
26.7
27.7
25.2
22.7
*
R(mm)
0
0
0.3
7.6
40.6
68.6
175.3
233.5
104.1
20.8
0
0
*
T = Temperature
*
R = Rainfall
The mean annual rainfall of station Y is
A.
54.2 mm
B.
175.3 mm
C.
233.5 mm
D.
408.8 mm
E.
650.8 mm
View Answer & Discuss
JAMB 1985
42
What climatic type is illustrated in the diagram above?
A.
Equatorial
B.
Sub-Equatorial
C.
Montane
D.
Mediterranean
E.
Monsoon
View Answer & Discuss
JAMB 1985
43
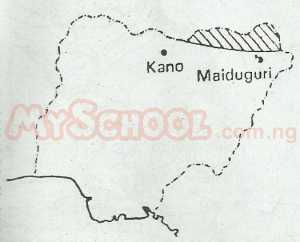
What is the correct combination of crops grown in the area shaded on the map of Nigeria above?
1. Yam 2. Sugar 3. Wheat 4. Maize 5. Millet 6. Onion
A.
1, 4, 5
B.
3, 5, 6
C.
1, 2, 4
D.
2, 3, 4
E.
4, 5, 6
View Answer & Discuss
JAMB 1985
44
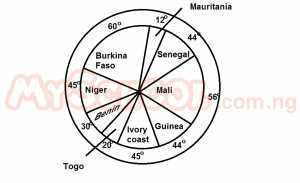
The diagram above shows the population in the French-speaking countries of West Africa in 1970.
From the diagram determine the population of the Ivory coast, If the total population of all the country was 32,300,000
A.
3.5 million
B.
3.8 million
C.
4.0 million
D.
4.3 million
E.
4.6 million
View Answer & Discuss (1)
JAMB 1985
45
COAL MINED IN % (WORLD)
From the graph above, it can be deduced that
A.
U.S.A consumes the greatest quanity of coal
B.
The developed countries produce most of the world's coal
C.
Africa nations do not produce good quality coal
D.
European countries produce the best quality coal
E.
World trade in coal is small
View Answer & Discuss
JAMB 1985
«
1
2
3
4
5
6
7
8
9
10
»
Start a Free Practice Test
Subjects
Mathematics
English Language
Chemistry
Physics
Biology
Geography
Literature in English
Economics
Commerce
Accounts - Principles of Accounts
Government
Christian Religious Knowledge (CRK)
Agricultural Science
Islamic Religious Knowledge (IRK)
History
Fine Arts
Music
French
Animal Husbandry
Insurance
Civic Education
Further Mathematics
Yoruba
Igbo
Arabic
Home Economics
Hausa
Book Keeping
Data Processing
Catering Craft Practice
Computer Studies
Marketing
Physical Education
Office Practice
Technical Drawing
Food and Nutrition
Home Management
Sign In
×
Username
Password
Remember me
Sign in
Don't have an account,
Click here to register