


The supply curve of a locally-produced good may shift to the right if
An increase in the price of commodity X led to a fall in the supply of commodity Y. Commodities X and Y are
(a) A hypothetical national income data for a country in particular year is presented below:
| ITEM | $MILLION |
| Wages and salaries | 250 |
| Income paid abroad | 75 |
| Income from self-employment | 120 |
| Stock appreciation | 5 |
| Interest | 10 |
| Income received from abroad | 50 |
| Rent | 25 |
| Depreciation allowance | 3 |
| Royalties | 2 |
| Profits and dividends | 35 |
From the data, answer the following questions.
Calculate the: Gross Domestic Product (GDP)
(b) A hypothetical national income data for a country in particular year is presented below:
| ITEM | $MILLION |
| Wages and salaries | 250 |
| Income paid abroad | 75 |
| Income from self-employment | 120 |
| Stock appreciation | 5 |
| Interest | 10 |
| Income received from abroad | 50 |
| Rent | 25 |
| Depreciation allowance | 3 |
| Royalties | 2 |
| Profits and dividends | 35 |
From the data, answer the following questions.
Calculate the: Gross National Product (GNP)
(c) A hypothetical national income data for a country in particular year is presented below:
| ITEM | $MILLION |
| Wages and salaries | 250 |
| Income paid abroad | 75 |
| Income from self employment | 120 |
| Stock appreciation | 5 |
| Interest | 10 |
| Income received from abroad | 50 |
| Rent | 25 |
| Depreciation allowance | 3 |
| Royalties | 2 |
| Profits and dividends | 35 |
From the data, answer the following questions.
Calculate the: Net National Product (NNP)

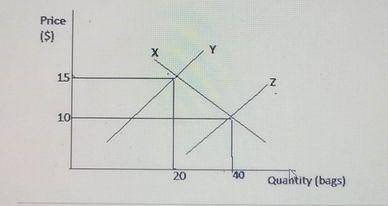
(ai) The diagram above shows the effects of the introduction of a subsidy on the production of maize. Study the diagram and answer the questions that follow.
Identify the curves labelled X,Y,Z
(aii) The diagram below shows the effects of the introduction of a subsidy on the production of maize. Study the diagram and answer the questions that follow.

State the direction of change in price and quantity with the introduction of subsidy
(bi) The diagram below shows the effects of the introduction of a subsidy on the production of maize. Study the diagram and answer the questions that follow.
Calculate the total revenue of the producers before the introduction of subsidy
(bii) The diagram below shows the effects of the introduction of a subsidy on the production of maize. Study the diagram and answer the questions that follow.
Calculate the total revenue of the producers after the introduction of subsidy
(c) The diagram below shows the effects of the introduction of a subsidy on the production of maize. Study the diagram and answer the questions that follow.
Calculate the percentage increase or decrease in total revenue of the producers with the introduction of subsidy
(d) The diagram below shows the effects of the introduction of a subsidy on the production of maize. Study the diagram and answer the questions that follow.
If the quantity demanded of maize increases from 20 to 40 bags as a result of a fall in price from $15 to $10, calculate the price elasticity of demand.
(e) The diagram below shows the effects of the introduction of a subsidy on the production of maize. Study the diagram and answer the questions that follow.
State the type of elasticity of demand in 2(d).
(a) Define the term limited liability
(b) Describe four differences between a public joint-stock company and a private joint-stock company
(c) Outline three sources of finance available to sole proprietorship
