


In a free market economy, resources are allocated through the
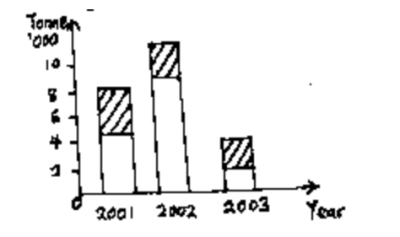
Use the figure below to answer the question that follows
What does the diagram above depict

The figure above shows the change in demand for Commodity X which is a normal good. Use it to answer the question that follows.
Which of the following caused the change in demand from D\(_{1}\) D\(_{1}\) to D\(_{2}\)D\(_{2}\)

Use the figure below to answer the question that follows

The curves D\(_{0}\)D\(_{0}\) and S\(_{0}\)S\(_{0}\) are the initial demand and supply curves respectively. What happens when government provides subsidies to producers?
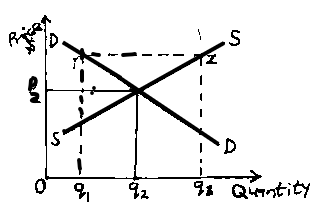
In the figure above, YZ represents
