


The graph of the schedule above will depict
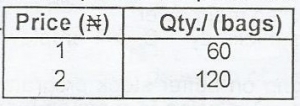
From that table above, the price elasticity of supply is
From the Diagram above, the optimal point of production is


The average total cost when 20 units are produced is
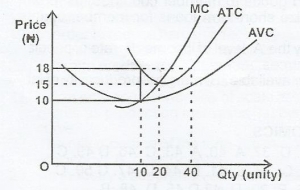
When 20 units of output is produced, TC will be
