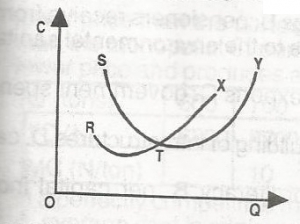
In the diagram above, RTX and STY are the marginal cost and the average cost curves responsively of a perfectly competitive firm. The supply curve of the firm is indicated by
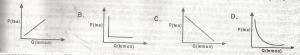
Which of the following graphs represents the price-quantity relationship between tea and lemon, if they are perfect complements? choose the answer from the option above
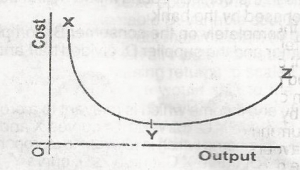
Consider the following diagram where XYZ represents the average curve of a firm. XY shows that as out put increases the average declines. However, this decline cannot continue indefinitely because