


The figure above shows the change in demand for Commodity X which is a normal good. Use it to answer the question that follows.
Which of the following caused the change in demand from D\(_{1}\) D\(_{1}\) to D\(_{2}\)D\(_{2}\)
Use the figure below to answer the question that follows

The curves D\(_{0}\)D\(_{0}\) and S\(_{0}\)S\(_{0}\) are the initial demand and supply curves respectively. What happens when government provides subsidies to producers?
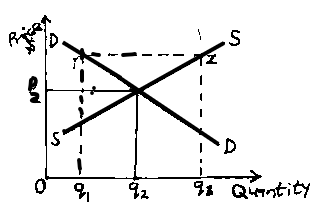
In the figure above, YZ represents

Goods are described as inferior if their demand
A consumer is in equilibrium when
