


The pie chart below shows the age distribution of population in thousands of an island Y for the year 2000 The total population of the island is 245,000.
Use the information supplied to answer the questions that follow (Show all workings clearly)
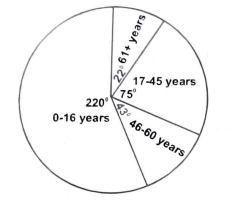
(a) Calculate the number of persons in the different age groups
(b) What is the dependency ratio of the population?
(c) Give three implications of the above population structure
(a) Distinguish between wants and demand
(b) With the aid of diagrams show the effect on demand when (i) there is a reduction in the number of 2200 consumers (ii) prices of substitutes increase
(iii) there is a decrease in 0-16 years the price of the commodity
(a) What is an economic system?
(b) Outline any four features of a capitalist economy.

(a) What is population census?
(b) Describe the problems faced in conducting a population census in your country.
(a) What is elasticity of supply?
(b) when is supply elastic?
(c) Explain any four factors that influence elasticity of supply.
