


Use the diagram below to answer the questions that follow.
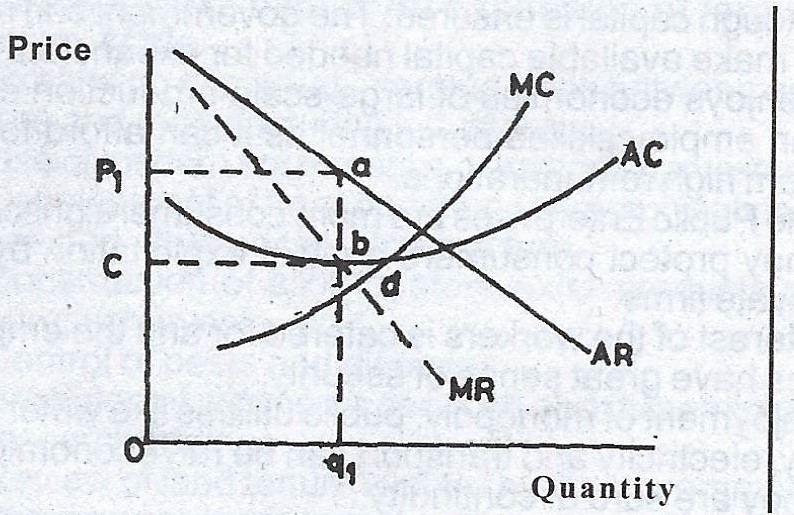
(b)(i) Which of the curves represents the monopoly demand curve?
(ii) What is the point on the diagram?
(iii) State the equilibrium price and quantity
(iv) Which area represent monopoly profits?
(c) If P\(_1\) q = 5 Naira and q\(_1\) = 50 units and C = 2 Naira, deter mine the monopoly profit.
The table below represents the output level of a particular firm producing soft drinks. Use the information in the table to answer the questions that follow.
| output (units) |
| 0 |
| 12 |
| 23 |
| 36 |
| 48 |
| 58 |
Give the cost equation of the firm in Naira as C = 20 + 2q where C is total cost and q is quantity produced, calculate:
(a) The total cost of producing: (i) 12 units of output (ii) 36 units of output.
(b) The average cost when: (i) 48 units were produced (ii) 58 units were produced.
(c) The marginal cost when: (i) 23 units were produced (ii) 36 units were produced.
(d) If the firm is operating in a perfectly competitive market and the market price is N5 per unit, determine the profit when: (i) 23-units are produced (ii) 48 units are produced.


(a) Explain any two causes of a declining population:
(b) Outline any three factors which determine the size of your country's working population.
(a) Describe each of the following:
(i) Abnormal demand
(ii) Effective demand
(b) Give three reasons for the occurrence of abnormal demand.