


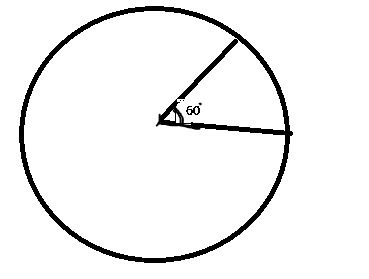
The pie chart above represents the total population of a school of 1,200. The shaded area of 60º shows the population of the underaged pupils.
What is the population of the matured students?
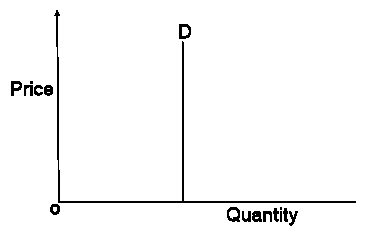
What type of price elasticity of demand is the diagram above representing?
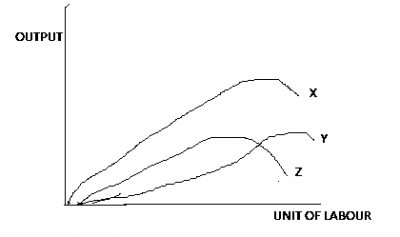
The curve labelled x is the


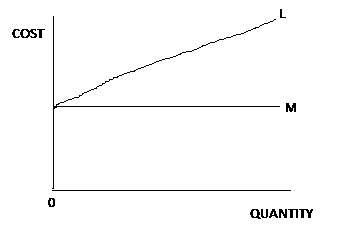
The line labelled M in the diagram above represent
The International Bank for Reconstruction and Development(IBRD) performs the following functions except-------