Topics:
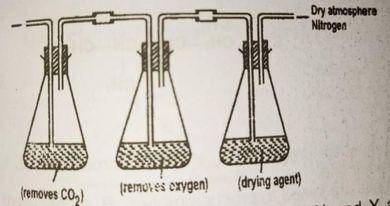
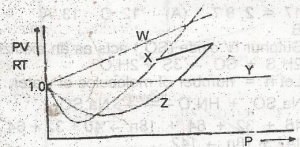
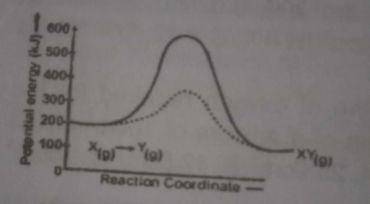
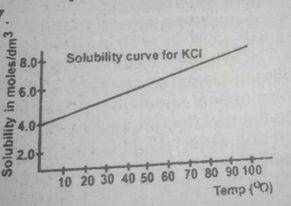
All Matter and Separation Techniques Particulate Nature of Matter BASIC CHEMISTRY Chemical Combinations Properties of Gases ( Gas Laws ) Properties of Solids and Liquids Acids, Bases and Salts Periodic Table Air and Air Pollution Water and Solubility Concept Mass-Volume Concepts Quantitative and Qualitative Analyses Electrodes, Electrochemical Series and Electrolysis Types of Reactions Energy and Chemical Reactions Reactions' Rates and Chemical Equilibria Shapes of Molecules and Solids Radioactivity ( Nuclear Chemistry ) INORGANIC CHEMISTRY Hydrogen ( Hydrides ) Oxygen ( Oxides - Ozone ) Carbon - Carbon Compounds Nitrogen - Nitrogen Compounds Phosphorus - Phosphorus Compounds Sulphur - Sulphur Compounds Halogen Family Silicon and its Compounds Metals and their Compounds 1 Transition Metals and their Compounds ORGANIC CHEMISTRY Hydrocarbons Crude Oil Basic Concepts of Organic Chemistry Organic Chemistry 2 Applied Chemistry Chemical Industry The Solar System Separation of mixtures and purification of chemical substance Definition and classification of matter Elements, compounds and mixtures Physical and chemical changes Pure and Impure substances Separation techniques/processes Chemical Combination Stoichiometry Laws of definite and multiple proportions Law of conservation of matter Gay Lussac's law of combining volumes Avogadro's law chemical symbols, formulae, equations and their uses Relative atomic mass based on 12C-12 The mole concept and Avogadro's number Kinetic Theory of Matter and Gas Laws States of matter Change of States of matter Phenomena Supporting Kinetic theory-Diffusion and Osmosis Assumptions of Kinetic theory of Gases The Gas Laws: Boyle, Charles, Graham and Dalton (law of partial pressure), combined gas law Molar volume and atomicity of gases The ideal gas equation (PV = nRT) The relationship between vapour density of gases and the relative molecular mass. Atomic Structure and Bonding The concept of atoms, molecules and ions, the works of Dalton, Millikan, Rutherford, Moseley, Thompson and Bohr Atomic structure, electron configuration, atomic number, mass number and isotopes. Shapes of S and P orbitals The Periodic table and periodicity of elements The variation of the following properties: ionization energy, ionic radii, electron affinity and electronegativity Chemical bonding Van der Waals' forces. Shapes of simple molecules Nuclear Chemistry Radioactivity - Types and properties of radiations Nuclear Reactions - Natural and Artificial Radioactivity, uses and Application. Air The natural gaseous constituents and their proportion in the air Air as a mixture and some uses of the noble gas Water Water as a product of the combustion of hydrogen and its composition by volume Water as a solvent Hardness of water Treatment of water for town supply. Water of crystallization, efflorescence, deliquescence and hygroscopy Solubility Unsaturated, saturated and supersaturated solutions Definition of Solubility and Solubility curves and simple deductions Solvents for fats, oil and paints False solution (Suspensions and colloids) Simple calculations on Solubility Environmental pollution Sources and effects of pollutants Air pollution Water pollution Soil pollution Acids, Bases and Salts Definition, General characteristics, types and properties of acids, bases and salts Acids/base indicators, basicity of acids and preparation of salts Oxides and trioxocarbonate (IV) salts Qualitative comparison of the conductances of molar solutions of strong and weak acids and bases Relationship between conductance and amount of ions present, and Buffer solutions pH and pOH scale; Simple calculations Acid/base titrations. Hydrolysis of salts Oxidation and Reduction (REDOX) Reactions Oxidation in terms of the addition of oxygen or removal of hydrogen. Reduction as removal of oxygen or addition of hydrogen. Oxidation and reduction in terms of electron transfer Use of oxidation numbers in defining REDOX reactions and balancing simple equations. IUPAC nomenclature of inorganic compounds using oxidation number Tests for oxidizing and reducing agents Electrolysis Electrolytes and non-electrolytes, and Faraday's laws of electrolysis Electrolysis of dilute H2SO4, aqueous CuSO4, CuCl2 solution, dilute and concentrated NaCl solutions and fused NaCl Factors affecting discharge of ions at the electrodes Uses of electrolysis Electrochemical cells: Redox series Half-cell reactions and electrode potentials Calculations on electrolysis Corrosion as an electrolytic process Energy changes Energy changes accompanying physical and chemical changes Endothermic and exothermic reactions. Entropy as an order-disorder phenomenon Spontaneity of reactions Rates of Chemical reaction Meaning of the rate of a chemical reaction. Ways of measuring the rate of chemical reaction Factors affecting rates of reaction Arrhenius’ law and Collision theory Reaction rate curves Chemical equilibrium Definition of the following terminologies: systems, reactions and dynamic equilibrium. Properties of a system in equilibrium Factors governing the equilibrium position Le Chatelier’s principle Equilibrium constant Non-metals and their compounds Hydrogen and Hydrides Halogens: Chlorine as a representative element of the halogen Oxygen and Oxides Sulphur and its compound Nitrogen and its compounds Carbon: Allotropes, Uses and properties. Metals and their compounds General properties of metals Alkali metals e.g. sodium Alkaline-earth metals Aluminium and its compound Tin Extraction from its ores Metals of the first transition series Iron Extraction from sulphide and oxide ores Copper Extraction from sulphide and oxide ores Alloy Organic Compounds Introduction to the tetravalency of carbon Alkanes: Homologous series in relation to physical properties Alkenes: Isomerism (structural and geometric isomerism) Alkynes: Ethyne Aromatic hydrocarbons e.g. benzene - structure, properties and uses Alkanols: Primary, secondary, tertiary Alkanals and alkanones Alkanoic acids Alkanoates Amines (Alkanamines): Primary, Secondary, and tertiary Carbohydrates Proteins: Primary structures, hydrolysis and tests Enzymes and their functions Polymers: Natural and synthetic rubber Industrial Chemistry Chemical industries: Types, raw materials and relevances Economics of Industrial process Importance of industrial chemistry in Nigeria