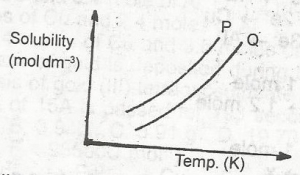
In the diagram above, the mixture of the solids P and Q can be separated by?
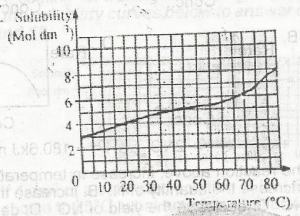
The diagram above is the solubility curve of a solute, X. Find the amount of X deposited when 500cm3 of a solution of X is cooled from 60oC to 20oC.
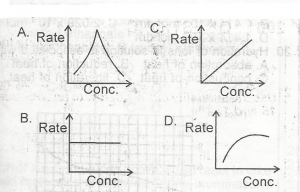
Use the option above to answer this question. The graph that describes a zero order reaction is
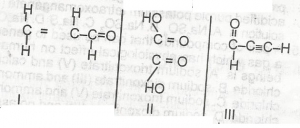
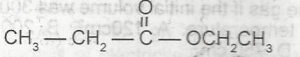
The compound above is an