


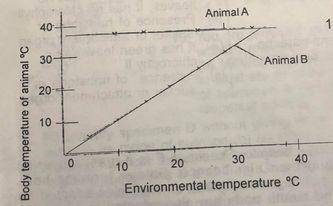
The graph below illustrates the changes in the body temperature of two animal A and B at different environmental temperatures. Study the graph carefully and use it to answer questions (a) to (c) (a) From the graph of the environmental to deductions on the effect of the environmental temperature on the body temperature of the animals indicated as (i) A (i) B (b) Suggest one way by which the animal indicated as B can maintain its body temperature or prevent its body from over-heating (c) Give one example each of an animal whose body temperature can be similarly affected by environmental temperatures cs (i) Animal A (ii) Animal B
Study specimens A,B, C and D carefully (a) ldentify specimens A and B without reason (b) Name the organism responsible for the damage observed on specimens A and B (c) List two ways by which each of specimens A and B can be properly stored (d) (i) ldentify specimens C and D without reason (i) List one animal or crop each that can be attacked by specimens C and D (ii) Explain how specimens C and D affect the crop or animal they infest (e) Name one way each by which a farmer can control specimens C and D (f) Make a labelled drawing 6-8 cm long of the dorsal view of specimen D.
(a) ldentify specimens E, F, G and H without reason (b) Name one excretory organ found in each o specimens E, F, G and H (c) (i) State the habitats of specimens E and H (i) Examine the limbs of specimen H. List two ways by which specimen H is adapted to the habitat (ii) Make a labelled drawing 8-10 cm long of specimen E

Specimens I and J are cross-sections of two plants whose cut ends were dipped in red ink or eosin (red dye) for at least 6 hours (a) Observe specimen I with the hand lens provided. Record your observation about the colouring of the tissues by the red ink or eosin.
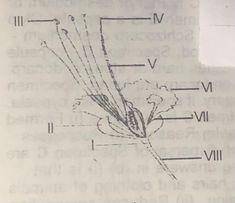
Which of the labellled parts represent the (a) female reproductive system (b) petal?
