The table below shows how a man spends his income in a month.
| Items | Amount Spent |
| Food | N4500 |
| House Rent | N3000 |
| Provisions | N2500 |
| Electricity | N2000 |
| Transportation | N5000 |
| Others | N3000 |
(a) Represent the information on a pie chart.
(b) What percentage of his income is spent on transportation?


| Item | Amount Spent (N) |
| Food | 4,500 |
| House Rent | 3,000 |
| Provisions | 2,500 |
| Electricity | 2,000 |
| Transportation | 5,000 |
| Others | 3,000 |
| Total | 20,000 |
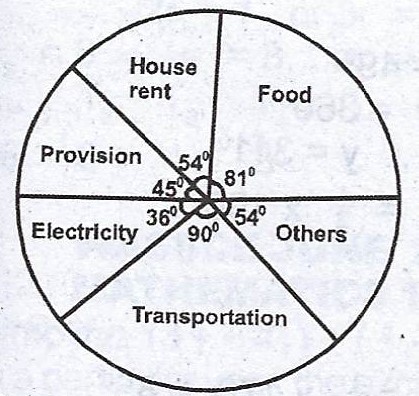
Items in degrees :
Food : \(\frac{4500}{20000} \times 360° = 81°\)
House rent : \(\frac{3000}{20000} \times 360° = 54°\)
Provisions : \(\frac{2500}{20000} \times 360° = 45°\)
Electricity : \(\frac{2000}{20000} \times 360° = 36°\)
Transportation : \(\frac{5000}{20000} \times 360° = 90°\)
Others : \(\frac{3000}{20000} \times 360° = 54°\)
(a) Pie chart :
(b) Percentage of his income spent on transportation :
\(\frac{5000}{20000} \times 100% = 25%\)


Contributions ({{ comment_count }})
Please wait...
Modal title
Report
Block User
{{ feedback_modal_data.title }}