Mathematics
WAEC 2012
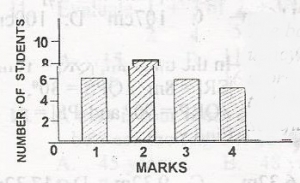
The bar chart shows the frequency distribution of marks scored by students in a class test. Calculate the mean of the distribution.
-
A.
6.0
-
B.
3.0
-
C.
2.4
-
D.
1.8
Correct Answer: Option C
Explanation
\(\begin{array}{c|c} x & f & fx\\ \hline 1 & 6 & 6 \\
2 & 8 & 16\\ 3 & 8 & 18\\ 4 & 5 & 20\end{array}\)
mean x = \(\frac{\sum fx}{\sum f}\)
= \(\frac{60}{25}\)
x = 2.4
Report an Error
Ask A Question
Download App
Quick Questions


Contributions ({{ comment_count }})
Please wait...
Modal title
Report
Block User
{{ feedback_modal_data.title }}