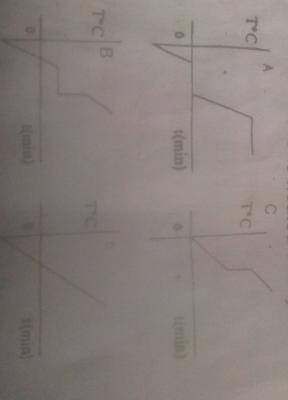
which of the following graphs clearly illustrates the temperature change which take place as a piece of ice at "-10" degrees Celsius is heated slowly?
In Physics
1 Answers Available
Asked by Michael on 15th December, 2022
Ask Your Own Question
Quick Questions
See More Physics Questions


Answers ({{ comment_count }})
Please wait...
Modal title
Report
Block User
{{ feedback_modal_data.title }}