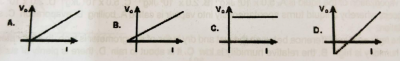
In the photoelectric effect, which of the following graphs correctly represents the graph of stopping potential Vo against frequency,f, of incident light?


Option D is the graph of stopping potential Vo against the frequency of the incident light I. The straight line graph cuts the intercept I = threshold frequency. As the frequency of the incident light increases above this point(threshold frequency), the stopping potential corresponding to the kinetic energy of the photoelectron also increases.
There is an explanation video available below.


Contributions ({{ comment_count }})
Please wait...
Modal title
Report
Block User
{{ feedback_modal_data.title }}