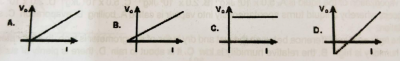
In the photoelectric effect, which of the following graphs correctly represents the graph of stopping potential Vo against frequency,f, of incident light?
a
A
b
B
c
C
d
D
Explanation
Correct Option
dVideo Explanation
Post your Contribution
Share:
Discussions (0)
No comments yet
Be the first to comment

